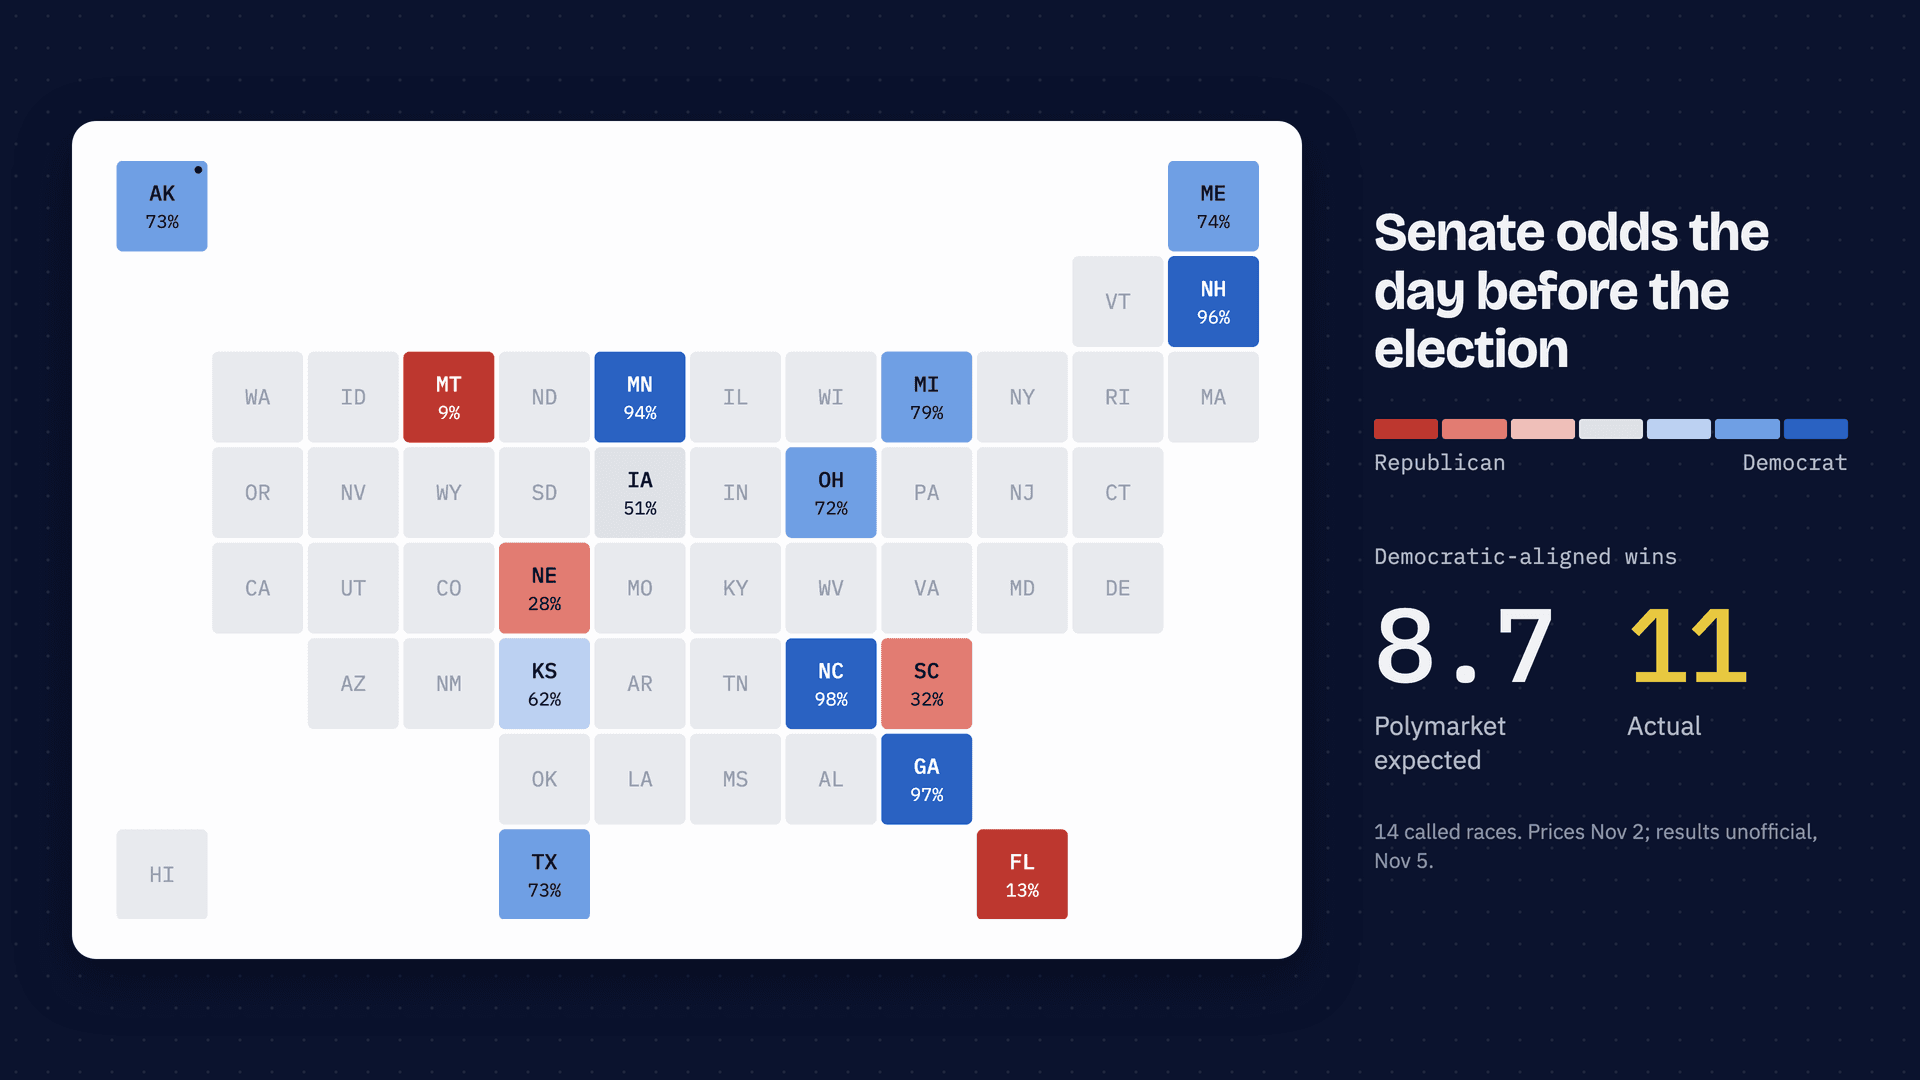
Prediction markets are the newest tool in election forecasting. More than $21 million was traded on Polymarket's Texas Senate market alone. A contract pays $1 if its candidate wins and nothing otherwise, so a 74-cent price means about a 74% chance.
In theory, traders with money on the line pay closer attention than anyone. The 2026 midterms let us test that by checking daily Polymarket prices and poll averages against the results. To dig into the data yourself, explore the Senate and governors' races in the Midterm Forecast Ledger.
We should say up front that we aren't political scientists or statisticians, just interested observers who like data.
What we found
Polls missed, and mostly in one direction. In 30 Senate and governor races with a prediction market and at least five recent polls, the final poll average underestimated the Democratic candidate in 25. On average, Democratic candidates ran about 3.5 points ahead of their polls.
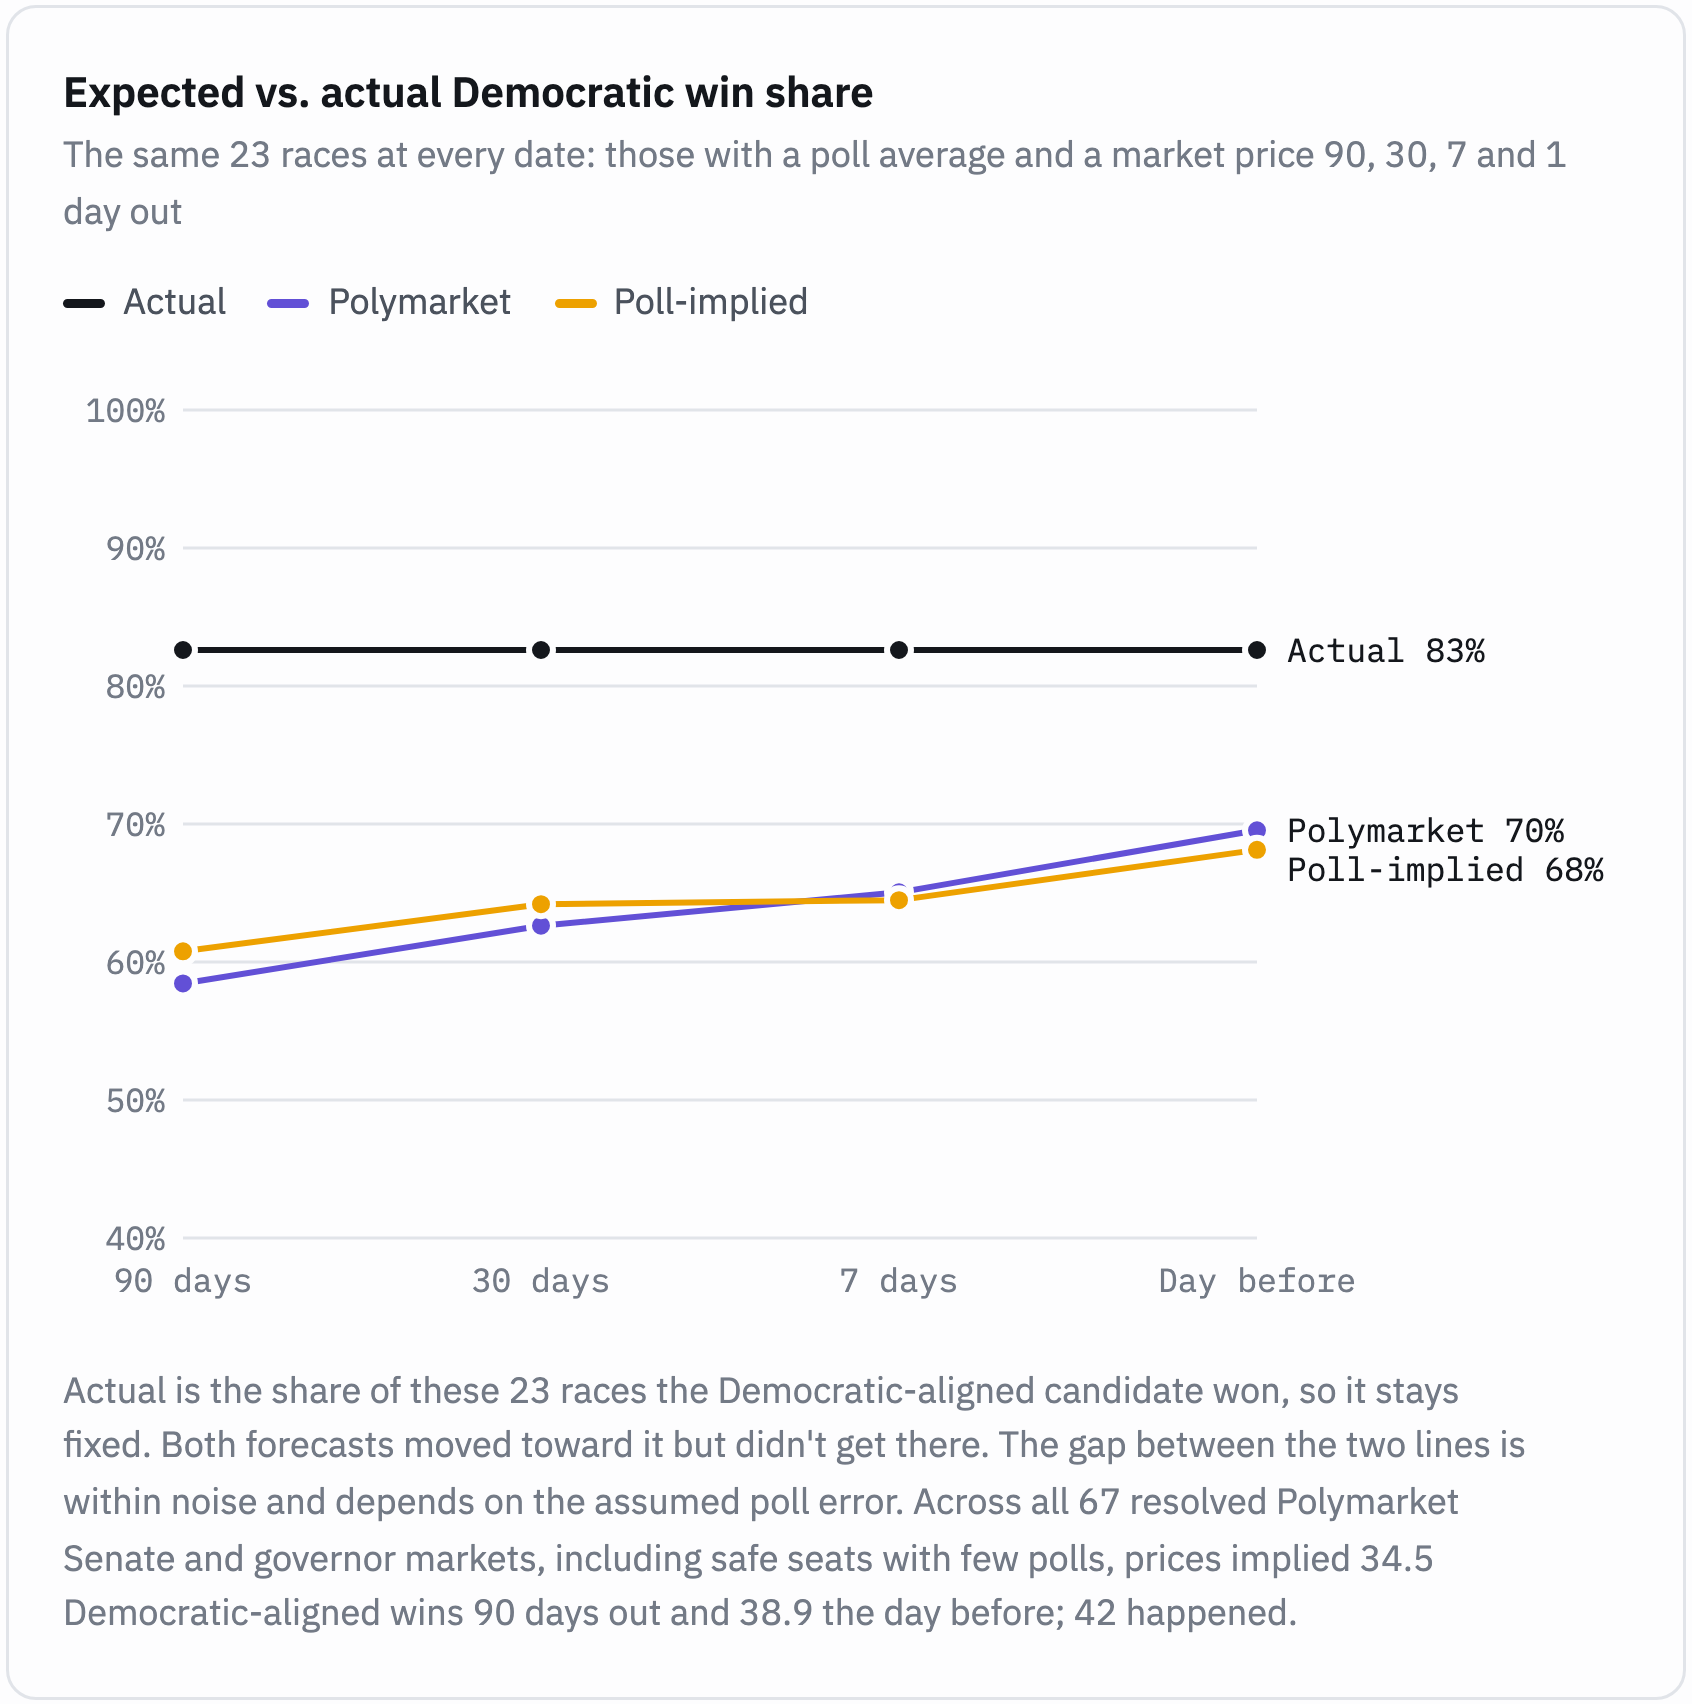
That gap shrank as Election Day approached but never closed. It was almost 6 points 90 days out, 5 a month out, about 4 a week out and 3.5 the day before. Prediction markets drifted at about the same pace. Across all 67 resolved Senate and governor markets on Polymarket, prices implied about 35 Democratic-aligned wins 90 days out and 39 the day before. The actual number was 42.
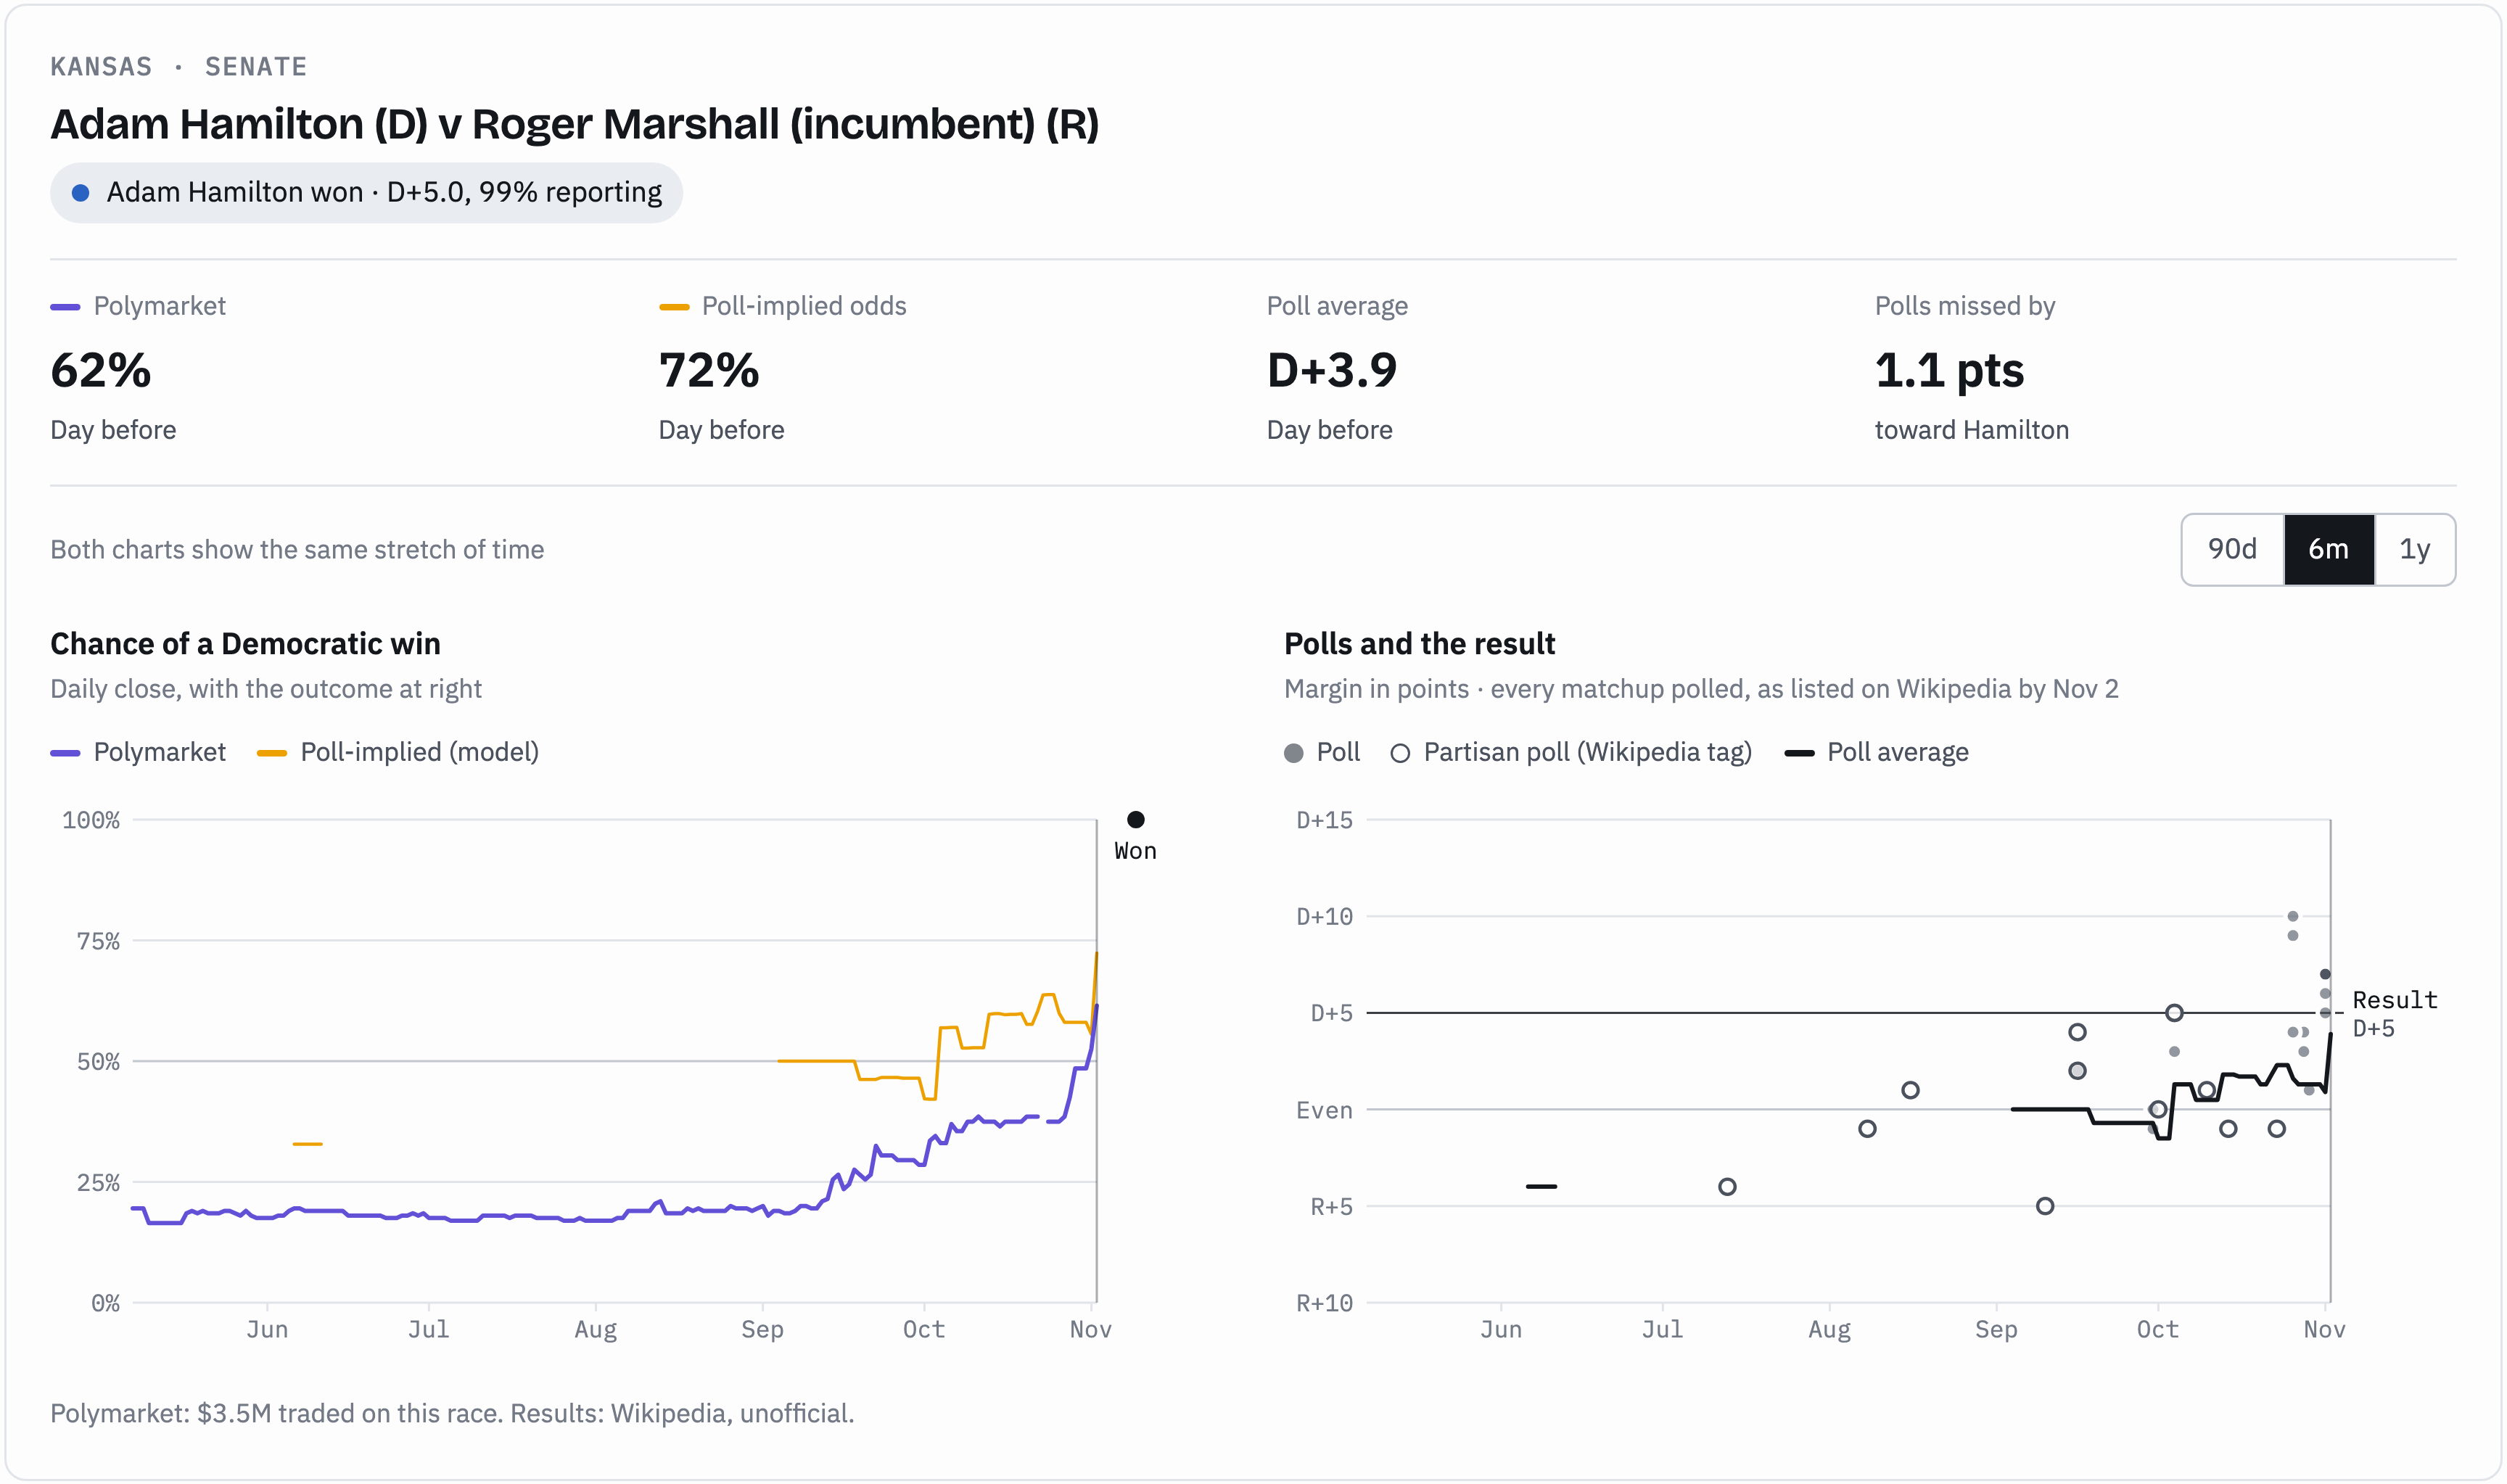
Some races moved a lot. Polymarket gave Kansas's Democratic Senate candidate an 18% chance in early August and 62% the day before, and the Democrat won by about 5 points. One of the biggest jumps followed a batch of new polls, a reminder that traders read polls too. Late moves weren't always right, either. In Florida's governor race, the Democrat rose from 25% to 35% in the final month and still lost.
Prediction markets and polls usually told similar stories, but we found 21 cases where they differed by 15 points or more. The prediction market ended up closer in 14 and the polls in 7. A week out, polls made Nebraska's Senate race a coin flip, while Polymarket gave independent Dan Osborn 28%. Osborn lost by about 7 points. In South Carolina, polls showed a near tie for months while Polymarket kept the Democrat at 32% or less, and the Democrat won by 4.5 points.
So did prediction markets capture the big swing in the 2026 results? Only partly. By the day before the election, prediction markets and polls had arrived at roughly the same picture by different routes, one from surveys and one from traders' bets, and they were about equally accurate. How much each one influences the other is a question worth digging into.
The hard part was making the data fit together
Every chart in the explorer combines a prediction market's price history, Wikipedia's poll tables and its results pages, and none of them were designed to fit together. Getting them to agree on something as basic as which candidate is which, or which day a poll belongs to, is where an analysis can quietly go wrong. That's the problem Belvedere is built for. Its AI agents blend data across sources and check its quality along the way, keeping every number traceable to its source and leaving the critical judgment calls to the people who know best.
Try it yourself
Pick a race to see the prediction market price, the polls and the result together. Then drag the slider back to August and see how much wisdom the crowd really had.
Explore the Midterm Forecast Ledger
Results are unofficial counts from Wikipedia as of November 5, 2026. Methods and caveats are on the explorer page.